Investigating Land Surface Temperature Variation and Land
Use Land Cover Changes in Pathumthani, Thailand (1997-2023) using
Landsat Satellite Imagery: A Comprehensive Analysis of LST and
Urban Hot Spots (UHS)
Thammaboribal, P.
Asian Institute of Technology, P.O. Box 4, 58 Moo 9, Km. 42,
Paholyothin Highway, Klong Luang, Pathum Thani 12120 Thailand
E-mail: prapasgnss@gmail.com
*Corresponding Author
DOI: https://doi.org/10.52939/ijg.v20i2.3063
Abstract
This study explores the dynamic transformations in land use and land
cover (LULC), land surface temperature (LST), and the spatial
distribution of Urban Hot Spots (UHSs) in Pathumthani from 1997 to
2023. Landsat satellite imagery was utilized for the analysis,
employing the Maximum Likelihood classifier for LULC
classification. The research reveals a substantial surge in
built-up areas, particularly notable with a twofold increase in 2023
compared to 1997, concentrated along the north-south axis. While
vegetation remains the dominant land cover, it experienced an
initial increase from 2004 to 2023, followed by a declining trend.
Nevertheless, vegetation constitutes over 60% of the total area,
concentrated in the eastern and western regions. In summary, the
spatial distribution of UHS in 1997 exhibited dispersion across the
study area. However, starting from 2004, there was a noticeable
concentration of UHSs within built-up areas, particularly in the
northern part, coinciding with the presence of the Navanakorn
industrial zone. Urban development encroachment into Muang
Pathumthani, Thanyaburi, and Lam Luk Ka districts led to the
emergence of UHSs in the southern part, mirroring the trajectory of
urban sprawl. This southern section, adjacent to Bangkok and in
proximity to Don Muang airport, witnessed UHS emergence due to
urban expansion, notably influenced by the development of the mass
rapid transit (MRT) connecting Pathumtani and Bangkok. The study
highlights the importance of studying Land Surface Temperature (LST)
to identify areas with higher temperatures, contributing valuable
insights for urban planning and strategies to mitigate heat-related
challenges in the region.
Keywords: Landsat, Land use land cover, LST, LULC,
Pathumthani, UHS
1. Introduction
The investigation of Land Surface Temperature (LST) and Land Use/Land
Cover (LULC) changes holds paramount significance in contemporary
environmental research, playing a pivotal role in understanding the
complex interplay between natural processes and human activities. These
analyses are essential for unraveling the intricate dynamics that
govern our planet's surface and are crucial components in addressing
pressing issues related to climate change, urbanization, and
sustainable land management LST serves as a key indicator of the
thermal behavior of the Earth's surface [1][2][3][4][5][6][7] and [8].
Fluctuations in LST are influenced by a myriad of factors, including
solar radiation, land cover types, elevation [9], and human activities.
Monitoring LST provides critical insights into the impacts of climate
change and human-induced alterations on local and regional
microclimates [10]. As the Earth's climate undergoes unprecedented
changes, studying LST becomes indispensable for predicting and adapting
to the evolving thermal conditions, mitigating the effects of urban
heat islands, and informing sustainable land use practices [11] and
[12].
Simultaneously, LULC changes serve as a barometer for assessing the
transformations in the Earth's surface brought about by human
activities. Urbanization, agricultural expansion, and deforestation are
examples of LULC changes that have profound implications for
ecosystems, biodiversity, and climate patterns. Investigating these
changes is crucial for understanding the drivers behind alterations in
land cover, predicting future trends, and formulating informed policies
for sustainable resource management and conservation [13].
The integration of LST and LULC change analyses is particularly
powerful, offering a comprehensive view of how human-induced and
natural factors converge to shape the Earth's surface conditions [14]
and [15]. The thermal implications of land cover alterations, such as
the impact of urbanization on local temperatures or the role of
vegetation in moderating surface heat, can be unveiled through this
combined approach [16]. In a world grappling with the impacts of
climate change and rapid urbanization, conducting LST and LULC change
studies becomes not just an academic pursuit but a practical necessity.
These investigations provide valuable data for climate scientists,
urban planners, policymakers, and environmentalists alike. Ultimately,
understanding the dynamics of LST and LULC changes is instrumental in
formulating strategies for sustainable development, fostering resilient
communities, and preserving the delicate balance between human
activities and the natural environment [17] and [18].
Pathumthani, a central province in Thailand, has undergone significant
transformations in both land surface temperature (LST) and land
use/land cover (LULC) over the past decade. This study leverages the
Landsat satellite series to examine the temporal dynamics of LST from
2010 to 2023 and its interplay with LULC changes, providing a
comprehensive analysis of how environmental factors influence thermal
patterns in the region. Landsat's high spatial and temporal resolution
offers an unparalleled opportunity to monitor and understand the
evolving landscape. The period under investigation coincides with a
noteworthy chapter in Pathumthani's history, marked by urban expansion,
agricultural intensification, and shifting land-use patterns. LULC
changes, encompassing transitions between natural, agricultural, and
urban areas, have profound implications for local microclimates and
subsequently impact LST. This study seeks to unravel the intricacies of
these changes, offering insights into the complex relationship between
human activities and environmental dynamics.
As urban areas expand and agriculture practices evolve, the thermal
characteristics of the land surface respond accordingly. The analysis of
LST in conjunction with LULC changes allows us to discern the thermal
implications of alterations in land cover types. Additionally,
understanding how vegetation and built-up structures influence LST is
vital for assessing the overall health and sustainability of the
environment [19]. In this research, we embark on a journey to identify
trends, hotspots, and potential driving forces behind the observed LST
variations in Pathumthani. The amalgamation of advanced remote sensing
techniques, Landsat's temporal coverage, and comprehensive LULC change
analyses equips us to offer valuable insights into the region's
environmental dynamics. The findings are expected to contribute
significantly to the ongoing discourse on sustainable land management,
climate resilience, and urban planning in Pathumthani and beyond.
2. Study Area
Pathum Thani, a province in the central region of Thailand as
illustrates in Figure 1, serves as a compelling study area for research
on LULC change and LST. This region, located just north of Bangkok,
holds economic and cultural significance, contributing to the overall
vitality of the nation. Its geographic composition includes a mix of
urban and rural landscapes, featuring areas of industrial development,
residential zones, and agricultural expanses [20].
As an economically vibrant province, Pathum Thani is poised for dynamic
LULC changes driven by factors such as population growth,
industrialization, and evolving agricultural practices. Understanding
these land use patterns is crucial for unraveling the economic dynamics
and urbanization trends within the region. Additionally, its proximity
to Bangkok suggests that the province may experience the Urban Heat
Island (UHI) effect, where urban areas exhibit higher temperatures than
surrounding rural areas. Investigating LST can provide valuable
insights into the extent of this phenomenon and its environmental
implications. Pathum Thani boasts diverse environmental features,
including water bodies, green spaces, and natural habitats. The study
of LULC changes becomes instrumental in assessing the impact of human
activities on these ecosystems. Furthermore, the tropical climate of
Pathum Thani, characterized by distinct wet and dry seasons, adds a
layer of complexity to the relationship between land use changes and
climate variability.
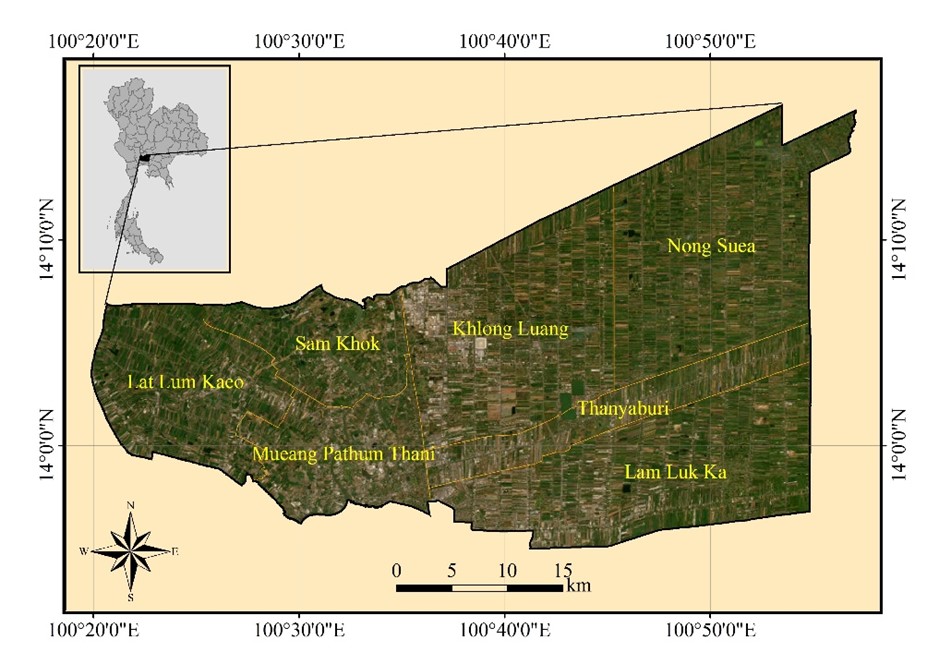
Figure 1: Study area in Pathumthani, Thailand
Table 1: Landsat satellites band designations [21]
|
Landsat 4-5 TM Landsat 7 ETM+
|
Landsat 8-9
OLI/TIRS
|
|
|
|
Band 1
|
Coastal/Aerosal
|
|
Band 1
|
Blue
|
Band 2
|
Blue
|
|
Band 2
|
Green
|
Band 3
|
Green
|
|
Band 3
|
Red
|
Band 4
|
Red
|
|
Band 4
|
NIR
|
Band 5
|
NIR
|
|
Band 5
|
SWIR-1
|
Band 6
|
SWIR-1
|
|
Band 6
|
TIR
|
Band 10
|
TIR-1
|
|
Band 11
|
TIR-2
|
|
Band 7
|
SWIR-2
|
Band 7
|
SWIR-2
|
|
Band 8
|
Pan
|
Band 8
|
Pan
|
|
|
|
Band 9
|
Cirrus
|
3. Methodology
3.1 Data Collection
This research is dedicated to examining the time series of LST in
Pathumthani province of Thailand by analyzing land cover changes and
vegetation loss. The selected periods for analysis are 1997 2003, 2012,
2018, and 2023, and the objective is to understand the evolution of
surface temperature over this timeframe. Landsat 5, 7, and 8 image data
were acquired for the specified years, and the LULC was classified into
four categories: (1) built-up areas; (2) vegetation areas; (3) water
body; and (4) bare land.
The classification of Land Use/Land Cover (LULC) employed a supervised
classification technique known as "maximum likelihood." Both visible
bands (R-G-B) and near-infrared (NIR) bands were incorporated in the
LULC classification process. Furthermore, a thermal band was employed
to estimate LST values. The satellite imagery was obtained from USGS
EarthExplorer, accessible at
https://earthexplorer.usgs.gov/. The
details of the Landsat series employed in this study are outlined in
Table 1. According to Table 1, the description of each Landsat series
as well as and their respective band spatial resolutions are as
follows:
Landsat 4-5 Thematic Mapper (TM) images comprise seven spectral bands
with a spatial resolution of 30 meters for Bands 1 to 5 and 7. Band 6,
the thermal infrared band, has a spatial resolution of 120 meters but
is resampled to 30-meter pixels.
Landsat 7 Enhanced Thematic Mapper Plus (ETM+) images consist of eight
spectral bands with a 30-meter spatial resolution for Bands 1 to 7.
Band 8 (panchromatic) has a higher resolution of 15 meters. All bands
offer two gain settings (high or low) for increased radiometric
sensitivity and dynamic range, except for Band 6, which collects both
high and low gain for all scenes.
Landsat 8 Operational Land Imager (OLI) and Thermal Infrared Sensor
(TIRS) images include nine spectral bands with a 30-meter spatial
resolution for Bands 1 to 7 and 9. The new Band 1 (ultra-blue) is
valuable for coastal and aerosol studies, and Band 9 aids in cirrus
cloud detection. Band 8 (panchromatic) maintains a higher resolution of
15 meters. Thermal bands 10 and 11, crucial for precise surface
temperature measurements, have a native resolution of 100 meters, but
they are resampled to 30 meters to align with the spatial resolution of
other bands. Landsat 9 instruments are enhanced duplicates of those on
Landsat 8 [22].
The Earth's surface experiences dynamic changes throughout the year,
including variations in solar angle, vegetation cover, and atmospheric
conditions. The followings are the factors that might affect the LST
analysis.
-
Seasonal Changes: Different seasons bring about variations in
surface characteristics such as vegetation growth, land cover,
and water availability. These changes can significantly impact
LST, and comparing data collected at different times of the
year may introduce confounding factors that hinder accurate
analysis.
-
Solar Angle: The angle and intensity of sunlight vary with the
seasons, affecting how surfaces absorb and emit thermal
radiation. Consistent timing of satellite imagery acquisition
helps maintain a similar solar angle, ensuring more reliable
comparisons of LST over time.
-
Vegetation Dynamics: Vegetation plays a crucial role in
regulating surface temperature through processes like
evapotranspiration. Seasonal changes in vegetation cover
influence the thermal properties of the land surface. Collecting
imagery in the same period helps control for these variations.
-
Atmospheric Conditions: Atmospheric conditions, such as
humidity and cloud cover, can impact the accuracy of thermal
measurements. Acquiring data during the same period helps
minimize the impact of these atmospheric variables, leading to more
consistent and comparable results.
-
Long-Term Trends: Monitoring LST over an extended period with
consistent timing enables the identification of long-term
trends and patterns, providing valuable insights into
climate-related changes, urban heat island effects, and other
environmental phenomena.
Therefore, the satellite imagery was gathered between 1997 and 2023,
specifically during the summer season, encompassing the hottest months
of the year, from March to May to maintain a consistent time frame for
satellite imagery collection in LST analysis which allows for more
accurate and meaningful comparisons. The data acquisition dates are
presented in Table 2. The images were obtained with minimal cloud
cover, accounting for less than 10%.
3.2 Land Use Land Cover Classification
Land use and land cover (LULC) classification through satellite imagery
involves the categorization of different Earth surface types based on
their spectral characteristics, as captured by remote sensing
satellites. The process plays a crucial role in monitoring and
understanding landscape changes over time. Initially, satellite imagery
is acquired and preprocessed to correct for atmospheric effects and
geometric distortions. Subsequently, representative areas known as
Regions of Interest (ROIs) are selected, and spectral information is
extracted to create a training dataset for the classification algorithm
[22].
The maximum likelihood algorithm, a widely utilized technique for LULC
classification [23], is employed in the next steps. This algorithm
calculates the probability of a pixel belonging to a specific land
cover class by assuming that the spectral values for each class follow
a normal distribution. The pixel is then assigned to the class with the
highest probability, facilitating the creation of a classified image.
Feature selection is essential to choose the most relevant spectral
bands for input to the algorithm, maximizing the separability of
different land cover classes.
Table 2: Data acquisition dates
|
No.
|
Year
|
Acquisition dates
|
Landsat series
|
|
1
|
1997
|
24 April 1997
|
Landsat 5 TM
|
|
2
|
2004
|
26 March 2004
|
Landsat 5 TM
|
|
3
|
2012
|
11 May 2012
|
Landsat 7 ETM+
|
|
4
|
2018
|
18 April 2018
|
Landsat 8 OLI/TIRS
|
|
5
|
2023
|
18 May 2023
|
Landsat 8 OLI/TIRS
|
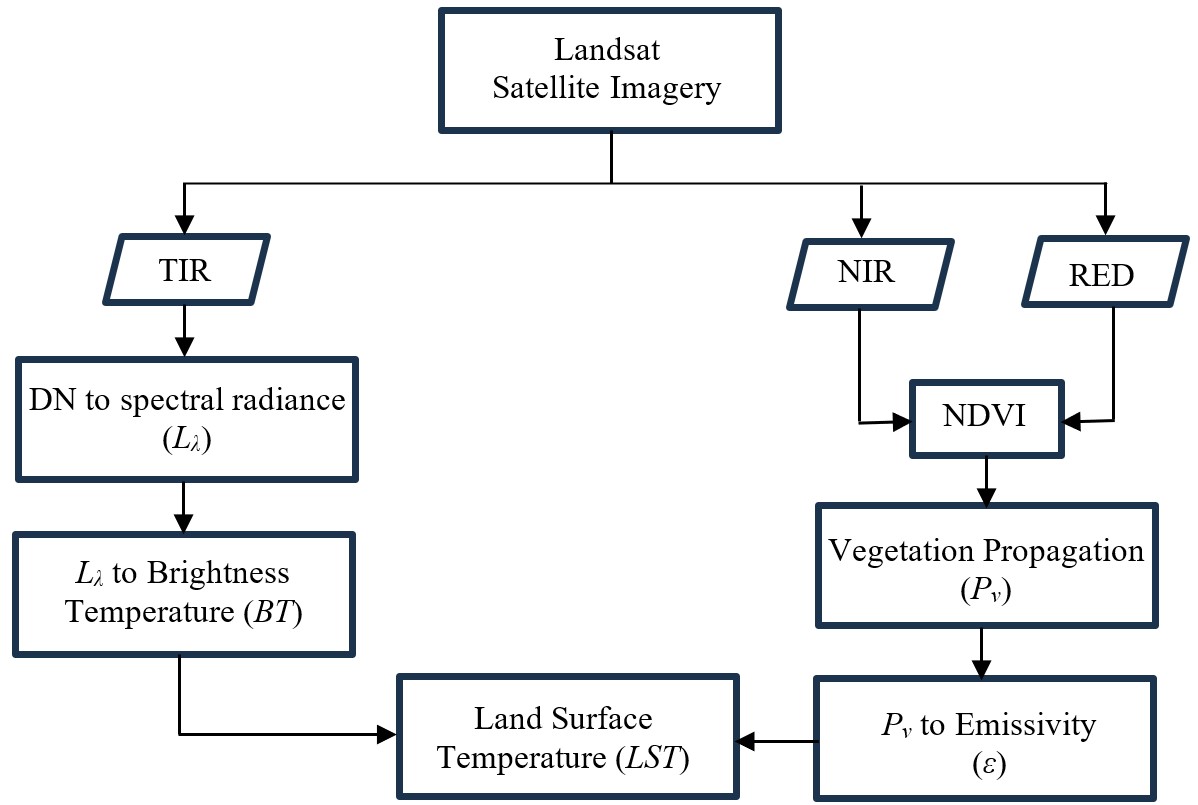
Figure 2: Determination of land surface temperature
(LST) using Landsat satellite imagery
The effectiveness of the maximum likelihood algorithm relies on
adhering to the assumptions of normality and equal covariance matrices
for spectral signatures and requires a supervised approach with
training samples for each land cover class [24][25] and [26]. In this
study, the LULC were categorized into 4 classes namely built-up area,
vegetation area, waterbody, and bareland./
3.3 Data Processing
The objective of this study is to investigate LST variation and LULC
change as well as the relation between LST and NDVI in Pathumthani from
1997 to 2023 using Landsat satellite imagery. The schematic depicting
the process of determining LST from Landsat satellite imagery is
illustrated in Figure 2. As per the schematic presented in Figure 2,
the steps for determining Land Surface Temperature (LST) are outlined as
follows:
The satellite imagery was downloaded from EarthExplorer, a platform
provided by the United States Geological Survey (USGS)
accessible at
https://earthexplorer.usgs.gov/. The acquisition dates of the data are
presented in Table 2. Convert the digital number (DN) of the thermal
infrared band (TIR) to spectral radiance (Lλ) using
Equation 1:

Equation 1
where:
Lλ is top of atmospheric radiance in Wm-2sr
-1μm-1
LMAXλ is spectral radiance scales to QcalMAX [17.04]
LMINλ is spectral radiance scales to QcalMIN [0]
QcalMAX is maximum quantized calibrated pixel value [255]
QcalMINis minimum quantized calibrated pixel value [0 for the products processed before 4/5/2004 and 1 for the products processed after 4/5/2004]
Qcal is digital number of the thermal band [DN]
Equation 1 is applied for the digital number (DN) conversion of Landsat
4-5TM and Landsat 7ETM+. Alternatively, if Landsat 8OLI imagery is
employed, the top-of-atmosphere radiance is determined using Equation
2:
Lλ = MLQcal + AL
Equation 2
Where:
ML is band specific multiplicative rescaling factor (RADIANCE_MULT_BAND_x) obtained from the metadata
AL is band specific additive calling factor (RADIANCE_ADD_BAND_x) obtained from the metadata
Qcalis digital number [DN]
When utilizing Band 10 of Landsat 8 in the study, the
ML
and AL values are 0.0003342 and 0.1, respectively.
Therefore, Equation 2 can be simplified to Equation 3:
Lλ = 0.0003342Qcal + 0.1
Equation 3
The top of atmospheric radiance (TOA) derived from equation 1 to
equation 3 is converted into brightness temperature using Equation 4.
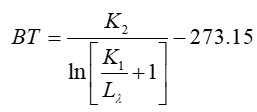
Equation 4
Where:
BT is brightness temperature [°C]
K1 is band specific thermal conversion constant (K1_CONSTANT_BAND_x)
K2 is band specific thermal conversion constant (K2_CONSTANT_BAND_x)
The constants K1and K2of each
Landsat series presents in Table 3. The quantity of vegetation is
crucial in estimating Land Surface Temperature (LST) [28]. To assess
this, the Normalized Difference Vegetation Index (NDVI) becomes
imperative. NDVI serves as an indicator of vegetation health by
evaluating how plant cell structures reflect light waves in both the
near-infrared band (NIR) and red band (RED). Equation 5 is used to
calculate NDVI.

Equation 5
Proportion of vegetation (PV) refers to the
proportion or fraction of an area that is covered by vegetation. It is
a measure that quantifies the extent of plant cover within a specific
area. This concept is commonly used to assess and monitor vegetation
cover in landscapes, ecosystems, or regions [29].
P V
is determined from Equation 6.

Equation 6
Where NDVImax and NDVImin are
the maximum and minimum of NDVI, respectively.
Land surface emissivity (ε) is a key factor in LST analysis.
It refers to the efficiency with which a surface emits thermal
radiation. In the context of remote sensing and thermal infrared
imagery, every object with a temperature above absolute zero emits
electromagnetic radiation. The rate at which this radiation is emitted
depends on the emissivity of the surface. For LST analysis, emissivity
is crucial because it influences the accuracy of temperature
measurements derived from thermal infrared data. Different surfaces
have different emissivity values, and emissivity is typically between 0
and 1 [30]. A surface with an emissivity of 1 is a perfect emitter
(blackbody), while a surface with an emissivity of 0 is a perfect
reflector.
Accurate knowledge of surface emissivity is particularly important when
analyzing temperature variations in different types of landscapes and
land cover. There are several models that utilize to determine the land
surface emissivity from NDVI.
Table 3: Band specific thermal conversion constants
[27]
|
Constant
|
Landsat 5
|
Landsat 7
|
Landsat 8 (B10)
|
|
K1 (Wm-2sr-1μm-1)
|
607.76
|
666.09
|
774.89
|
|
K2 (Kelvin)
|
1,260.56
|
1,282.71
|
1,321.08
|
Sobrino et al., [31] formulated an improved equation for calculating
land surface emissivity. The equation utilizes the mean value for soil
emissivity from the ASTER spectral library (
http://asterweb.jpl.nasa.gov), as presented in Equation 7.
ε = 0.004PV + 0.986
Equation 7
Mono window algorithm as presented in Equation 8 allows the
determination of Land Surface Temperature (LST).
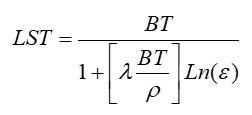
Equation 8
Where:
BT is brightness temperature determined from Equation 4
λ is wavelength of the TIR band
ρ is constant [14,380]
Urban hot spot (UHS) is a localized area within an urban environment
where temperatures are particularly high or where the effects of the
urban hot spots are more pronounced. These hot spots may occur
due to specific factors such as intense human activities, specific land
use patterns, or variations in surface materials [32]. UHS is defined
in equation 10 [33].
LST > μ + 2σ
Equation 9
Where μ and σ are the mean and standard deviation of
LST, respectively. The area where the LST surpasses the threshold
specified in equation 10 is designated as an UHS.
4. Results and Discussion
4.1 LULC changes from 1997 to 2023
In this study, the LULC were categorized into four classes: water body,
built-up area, vegetation area, and bare land. The LULC classification
employed the maximum likelihood classifier, the LULC classification
employed the maximum likelihood classifier, and the corresponding
results are presented in Figure 3, and the details of land use land
cover (LULC) changes are presented in Table 4 and Figure 4. Figure 3
unmistakably illustrates a noteworthy surge in built-up areas spanning
the temporal interval from 1997 to 2023. The augmentation of the
built-up area in 2023 exhibits a twofold increase when juxtaposed with
the corresponding 1997 values, notably along the north-south axis,
particularly evident along Paholyothin Rd in the Klongluang district
and Ransit-Nakornnayok Rd in the Thanyaburi district. Figures 3, 4, and
Table 4 illustrate that the predominant land cover in the study area is
characterized as vegetation. In 2004, the vegetation area increased
from 960.35 km2 to 1196.03 km2, but subsequently exhibited a declining
trend from 2004 to 2023. Nevertheless, vegetation still comprises more
than 60% of the total area. The vegetation areas are predominantly
located in the eastern and western regions of Pathumthani, specifically
in Nong Suea and Lad Lum Kaew districts, respectively.
A notable transformation in bareland was observed between 1997 and
2004. In 1997, bareland accounted for 22.25% of the area, but by 2004,
it had reduced significantly to 2.29%, maintaining a range of 2%-6%
thereafter. The built-up area exhibited a gradual increase from 1997 to
2018, with the built-up area covering 25% of the province in 2023.
Conversely, the water body area did not undergo significant changes from
1997 to 2023, consistently occupying approximately 1%-3% of the total
area. The variability in bareland area alterations was indeterminate;
as depicted in Figure 3, bareland regions exhibited a stochastic
distribution within the vegetation area on an annual basis. The
seemingly random occurrence of bareland can likely be attributed to
agricultural activities such as cultivation and plowing of crops within
the vegetation area, leading to the observation of small-scale bareland
pockets within these vegetated regions.
4.2 LST Variation from 1997 to 2023
Figure 5 depicts high temperature in LST for the years 1997, 2004, and
2023, surpassing that observed in 2012 and 2018. The findings further
indicate that the LST in 2023 is the highest recorded since 1997,
reaching 45 °C. Particularly, heightened LST regions were discerned
within the built-up area, notably along the north-south axis
encompassing Paholyothin Rd. and along Rangsit-Nakornnayok Rd. in the
eastern segment of the study area. Additionally, each annual high LST
region was consistently observed within the built-up area, contrasting
with the comparatively lower temperatures noted in the vegetation area.
The LST statistics extracted from Figure 5 are presented in Table 5 and
Figure 6. Table 5 and Figure 6 describe the LST across the years 1997,
2004, 2012, 2018, and 2023. A discernible trend is evident, wherein the
average LST exhibits a gradual decrease from 1997 to 2018, reaching its
lowest at 31.3 °C in 2018, and upswing to the highest of 38.5 °C in
2023.
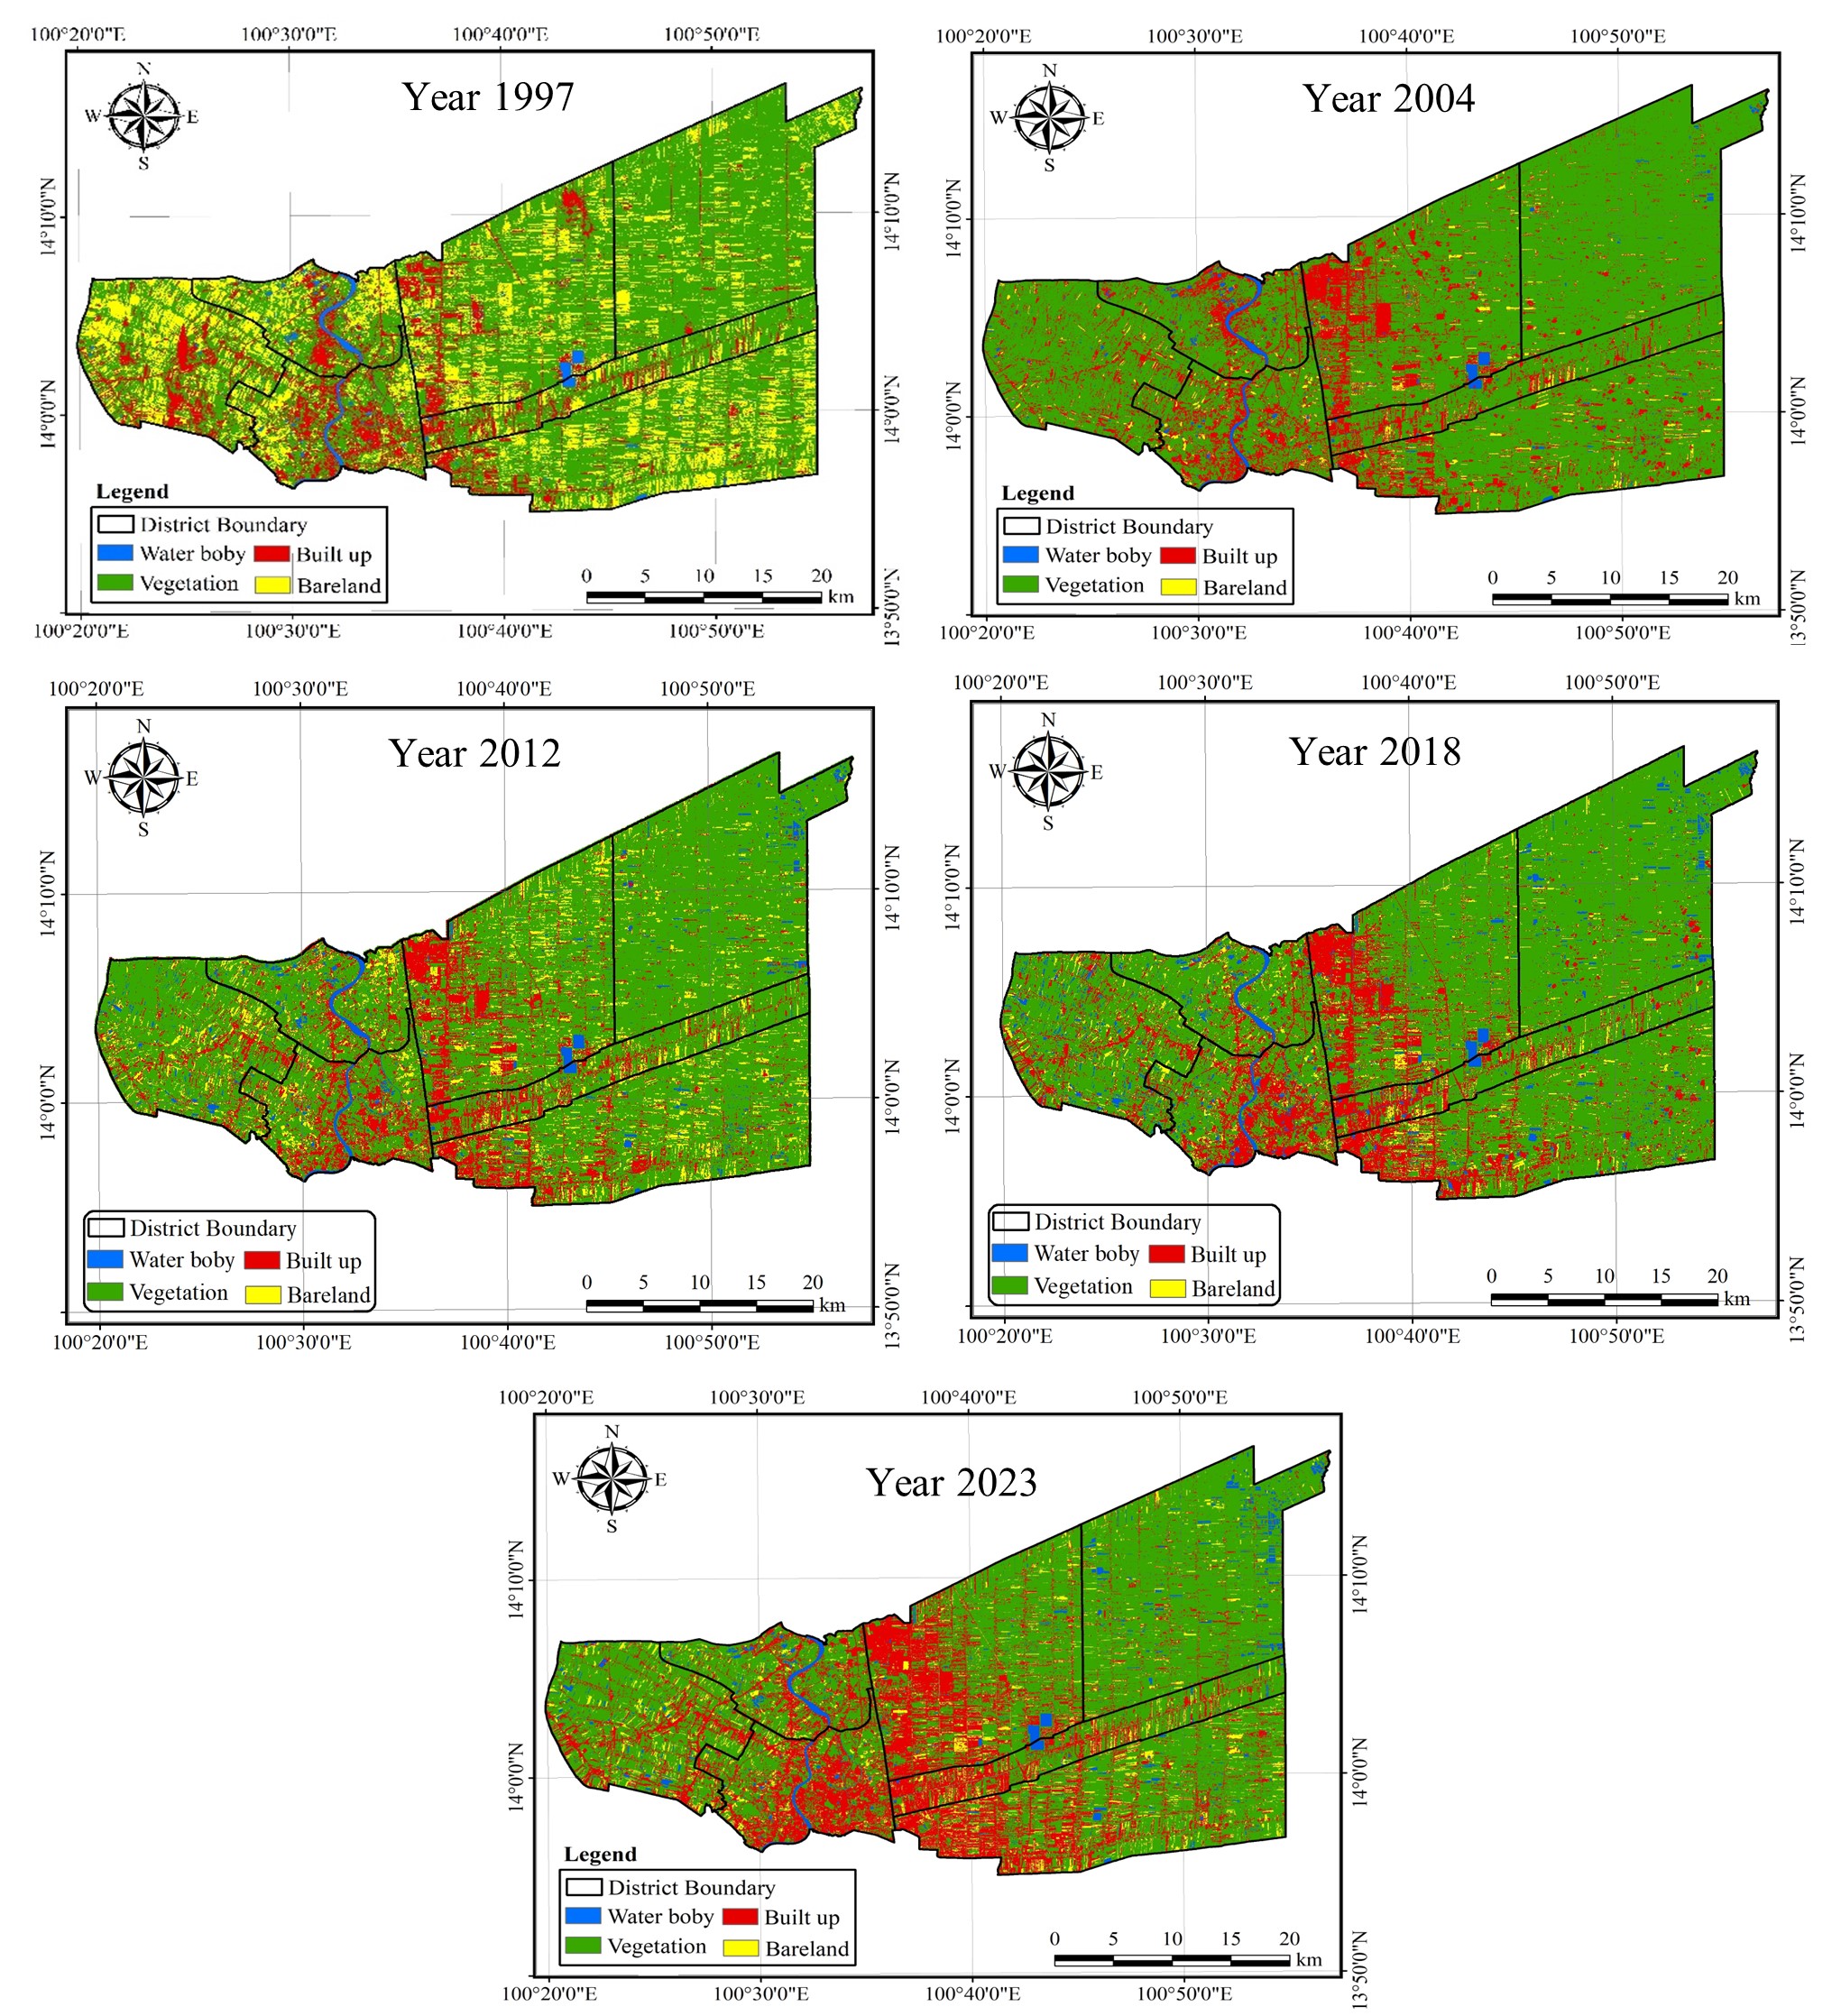
Figure 3: LULC of Pathumthani change from 1997 to
2023
Table 4: Areas of LULC in Pathumthani from 1997 to
2023
|
Year
|
Built up
|
Vegetation
|
Bareland
|
Water body
|
|
km2
|
%
|
km2
|
%
|
km2
|
%
|
km2
|
%
|
|
1997
|
190.94
|
12.58
|
960.35
|
63.29
|
345.20
|
22.75
|
20.90
|
1.38
|
|
2004
|
265.02
|
17.47
|
1196.03
|
78.82
|
34.77
|
2.29
|
21.58
|
1.42
|
|
2012
|
272.29
|
17.94
|
1146.19
|
75.54
|
60.99
|
4.02
|
37.92
|
2.50
|
|
2018
|
279.81
|
18.44
|
1125.67
|
74.18
|
59.77
|
3.94
|
52.14
|
3.44
|
|
2023
|
384.74
|
25.36
|
995.37
|
65.60
|
96.99
|
6.39
|
40.30
|
2.66
|
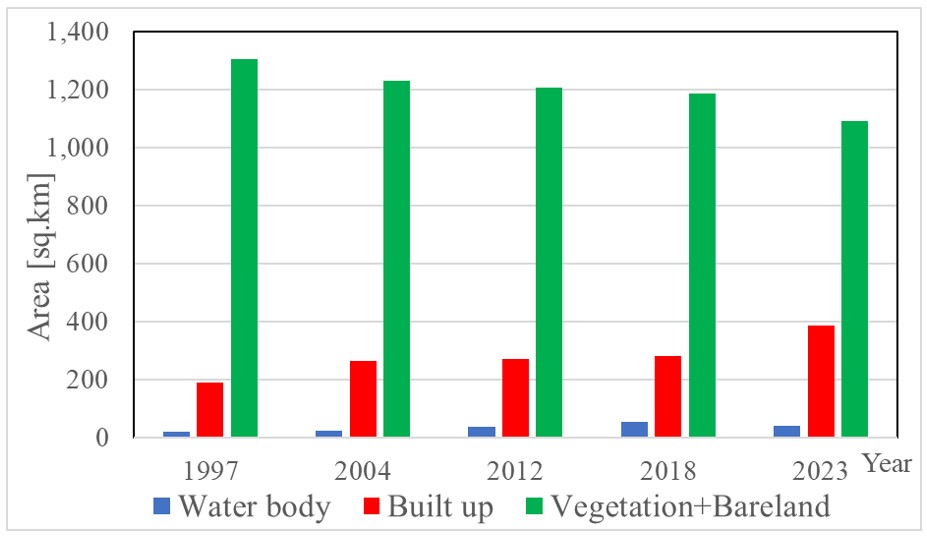
Figure 4: LULC Area changes in Pathumthani from 1997
to 2023
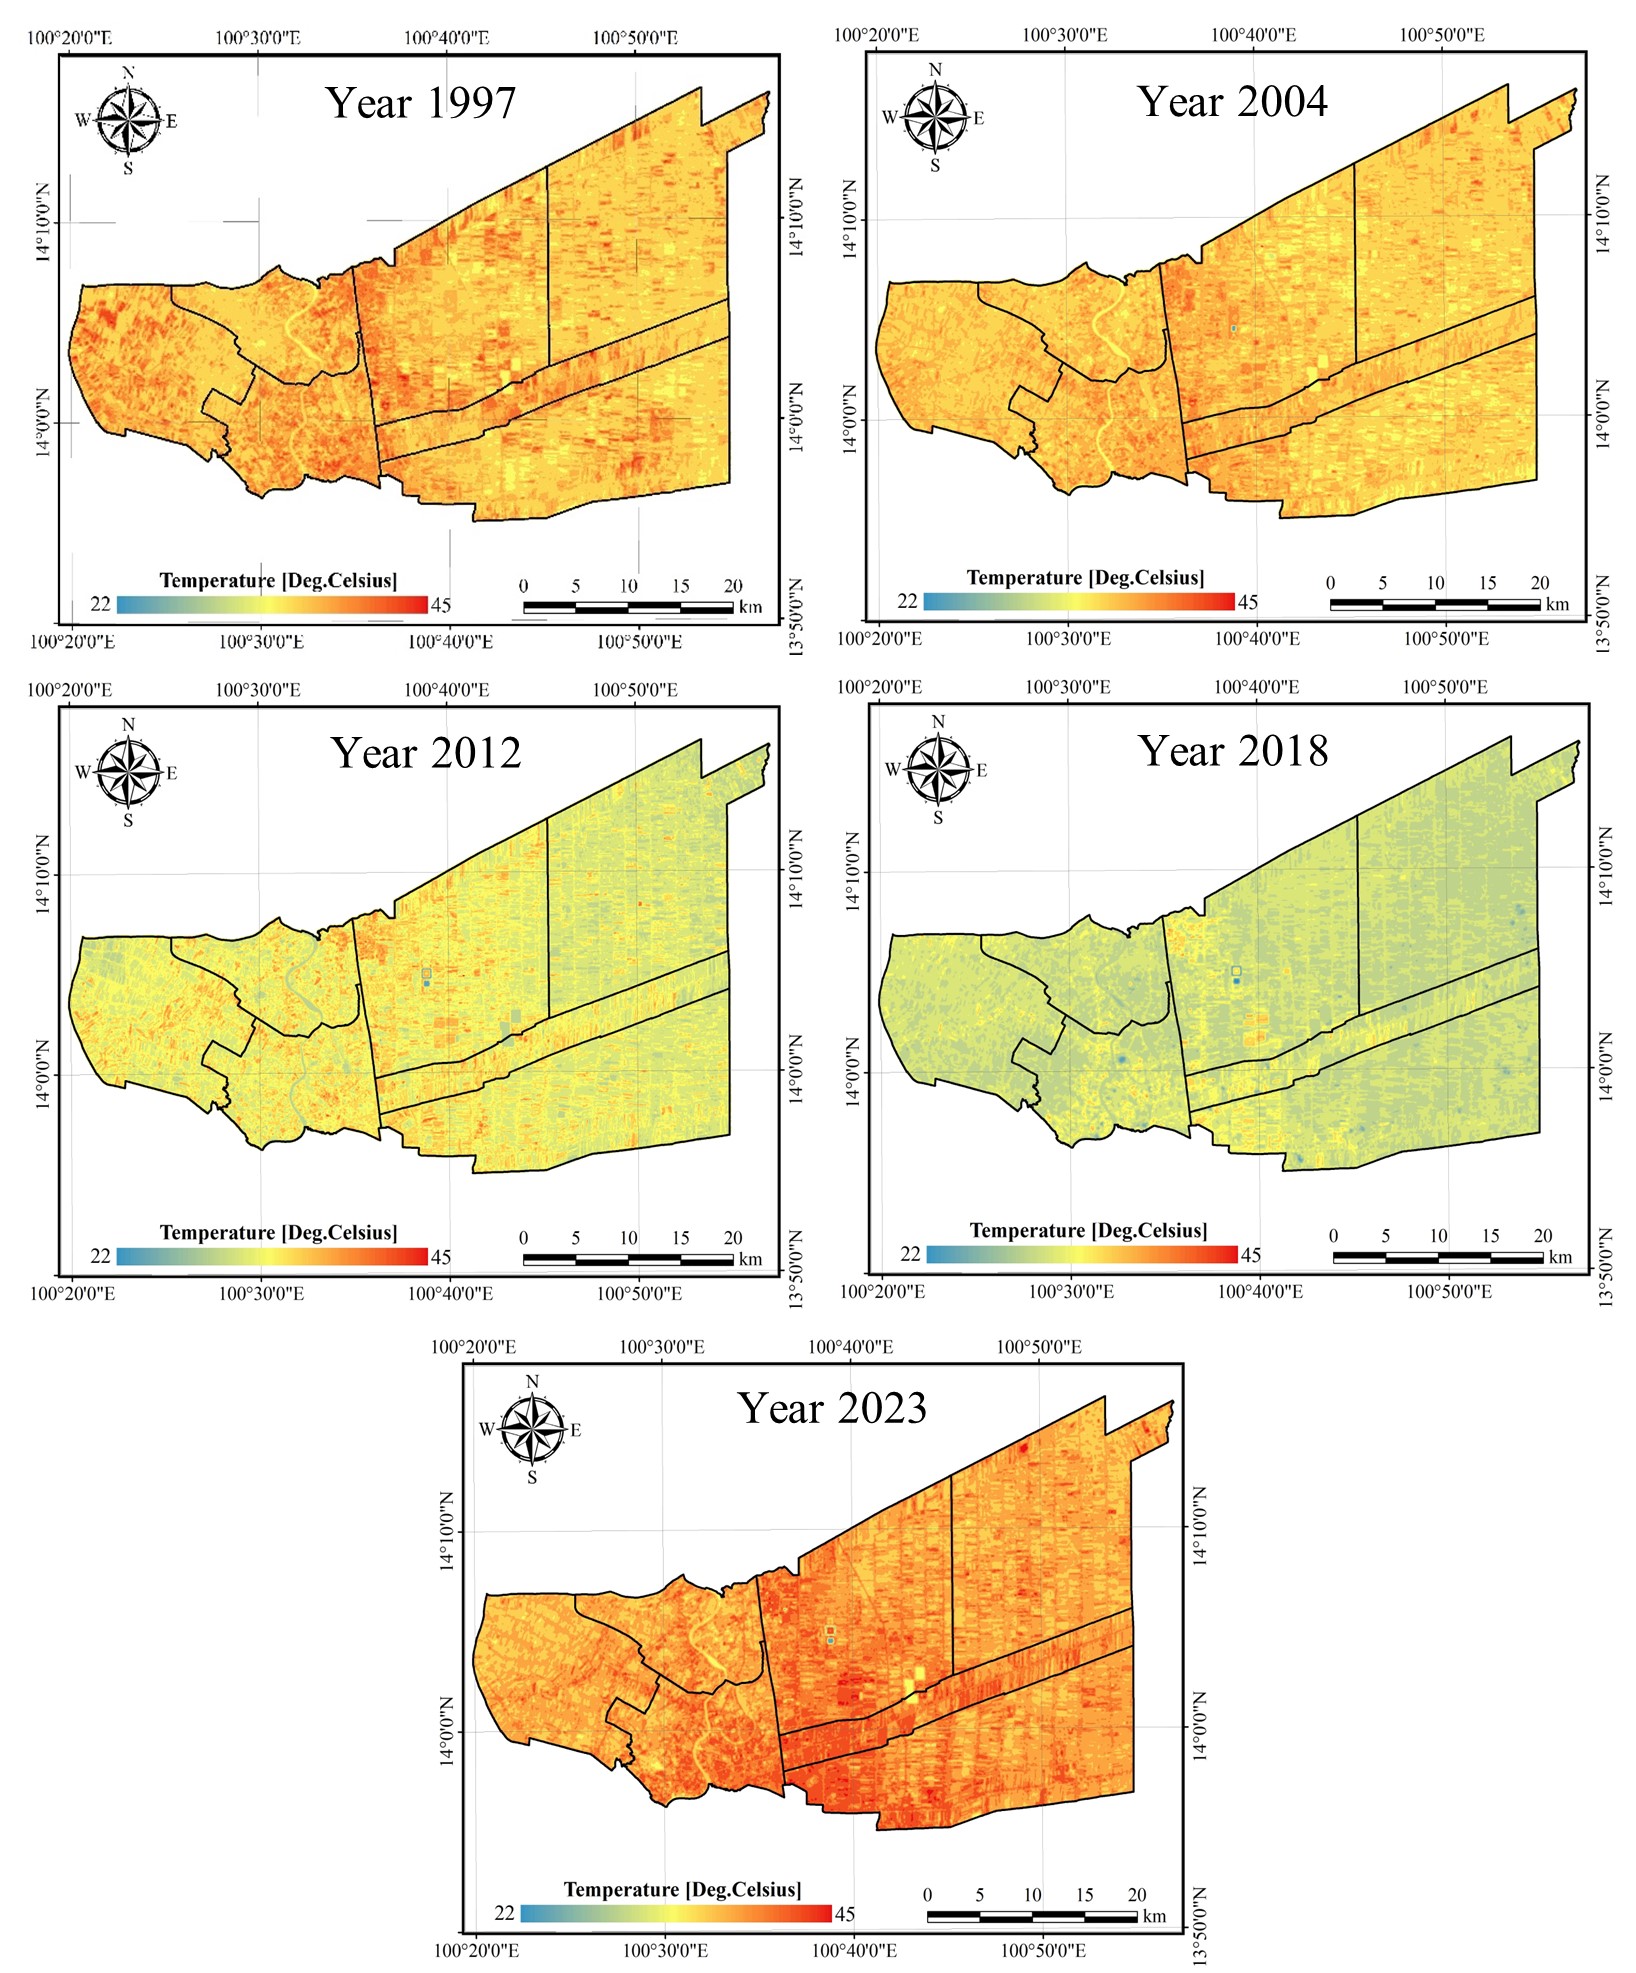
Figure 5: LST variation of Pathumthani from 1997 to
2023
Table 5: LST statistics of Pathumthani, Thailand from
1997 to 2023
|
Year
|
Min [°C]
|
Max [°C]
|
Mean [°C]
|
SD [°C]
|
|
1997
|
31.8
|
43.4
|
37.4
|
1.8
|
|
2004
|
23.0
|
42.8
|
36.7
|
1.4
|
|
2012
|
22.7
|
40.7
|
33.6
|
1.9
|
|
2018
|
20.7
|
38.8
|
31.3
|
1.2
|
|
2023
|
22.8
|
45.2
|
38.5
|
1.8
|

Figure 6: Average LST of Pathumthani
The average LST difference in 2018 (the lowest) and 2023 (the highest)
was 7.2 °C. Notably, these findings appear incongruous with the
prevailing global climate scenario, characterized by an overarching
trend of escalating temperatures attributed to the phenomenon of global
warming.
El Niño and La Niña represent climate patterns in the eastern tropical
Pacific. These phenomena are delineated by the Oceanic Niño Index
(ONI), recognized as the standard by the National Oceanic and
Atmospheric Administration (NOAA). Calculated from the running 3-month
average sea surface temperature (SST) anomaly within the Niño3.4 region,
spanning 5°N to 5°S and 120°W to 170°W, the ONI serves as a key metric
for assessing these climatic events. The phenomena are characterized by
five consecutive overlapping 3-month periods with temperatures either
at or above a +0.5°C anomaly for warm (El Niño) events or at or below a
-0.5°C anomaly for cool (La Niña) events. The threshold is classified
into different categories: Weak (0.5 to 0.9 SST anomaly), Moderate (1.0
to 1.4), Strong (1.5 to 1.9), and Very Strong (≥2.0) events [34].
According to ONI provided by NOAA, available at
https://ggweather.com/enso/oni.htm, it is evident that El Niño
phenomena did not occur in 1997 and 2004. Consequently, LST difference
between these two years amounted to 0.7°C. La Niña events were observed
in 2012 and 2018, contributing to lower LST values compared to 1997 and
2004.
In 2023, there was a substantial increase in LST compared to 2018,
indicating elevated temperatures across the study area. The heightened
LST in 2018 resulted from a moderate El Niño event. Although Thailand
is not directly impacted by El Niño and La Niña phenomena, during El
Niño periods, the country may experience elevated temperatures beyond
normal levels, potentially leading to adverse weather events in
specific areas [35] and [36]. It can be summarized that the typical
average LST for Pathumthani is expected to fall within the range of
36-37.5 °C.
4.3 UHS from 1997 to 2023
In this investigation, UHSs were employed to delineate areas
characterized by elevated LST within the designated study region. A UHS
is defined as a location where the LST surpasses two standard
deviations above the average LST. As illustrated in Figure 5, the UHSs
were dispersed across the study area in 1997. However, starting from
2004 and continuing through subsequent years, the UHSs became
concentrated within built-up areas. Specifically, in 2004 and 2012, UHSs
were observed predominantly in the northern part, coinciding with the
location of the Navanakorn industrial zone, covering 1,040 hectares on
Km.46 of Paholyothin highway in Khlong Luang district. The encroachment
of urban development into Muang Pathumthani, Thanyaburi, and Lam Luk Ka
districts led to the southern part of the study area experiencing UHSs,
mirroring the direction of urban sprawl.
This southern section, adjacent to Bangkok-the capital of Thailand-and
in proximity to Don Muang airport, witnessed UHS emergence due to urban
expansion. Notably, the development of the mass rapid transit (MRT)
connecting Pathumtani and Bangkok contributed significantly to urban
sprawl in the southern direction. In 2023, numerous housing estates
have emerged in the southern part of the study
area, specifically in the Lam Luk Ka district. Additionally, expansive
housing estate developments were observed in Khlong Sam (Canal no.3), a
sub-district of Thanyaburi district situated in the central region of
the study area. Figure 7 illustrates that UHSs were predominantly
observed in the housing estate areas and occasionally in the industrial
zone.

Figure 7: UHSs of Pathumthani from 1997 to 2023
This is because the surface of housing estate is considerable rougher
than that of industrial zone. Rough surfaces generally absorb more heat
than smooth surfaces. Rough surfaces have a larger surface area and,
consequently, more areas for incident radiation to be absorbed [37].
The increased surface area allows for greater absorption and retention
of heat. In contrast, smooth surfaces reflect more sunlight and absorb
less heat due to their reduced surface area and higher reflectivity.
The specific material properties, color, and composition of the
surfaces also play a role in their heat absorption characteristics
[38]. Dark-colored surfaces tend to absorb more heat than light-colored
ones, as they absorb a greater portion of the incident solar radiation
[39]. Consequently, UHSs) exhibit a tendency to manifest in housing
estates rather than other LULC types.
5. Conclusion
The study reveals a substantial increase in built-up areas from 1997 to
2023, with a particularly noteworthy twofold surge observed in 2023
compared to 1997. This urban expansion is most pronounced along the
north-south axis, prominently visible along Paholyothin Rd in the
Klongluang district and Ransit-Nakornnayok Rd in the Thanyaburi
district. While the dominant land cover in the study area is
characterized as vegetation, the vegetation area experienced an initial
increase from 2004 to 2023, although showing a declining trend
thereafter. Nevertheless, vegetation continues to constitute over 60%
of the total area, with concentrations in the eastern and western
regions of Pathumthani, specifically in Nong Suea and Lad Lum Kaew
districts.
LST data can provide insights into local climate trends and changes.
Monitoring temperature variations over time is essential for
understanding the impact of climate change on the region. Higher land
surface temperatures can have health implications, particularly during
heatwaves. Investigating LST can help identify areas prone to extreme
temperatures, allowing for better public health planning and response
strategies. LST data is also valuable for monitoring environmental
changes, including land cover modifications and vegetation health. This
information is vital for sustainable land management practices and
biodiversity conservation. Additionally, LST data is essential for
urban planners to design resilient and sustainable cities. It helps
identify heat-prone areas and supports the implementation of green
infrastructure and other measures to enhance urban livability.
The spatial distribution of UHSs in 1997 showed dispersion throughout
the study area. However, from 2004 onward, there was a notable
concentration of UHSs within built-up areas. Specifically, in 2004 and
2012, UHSs were predominantly observed in the northern part, aligning
with the location of the Navanakorn industrial zone. Urban development
encroachment into Muang Pathumthani, Thanyaburi, and Lam Luk Ka
districts resulted in UHSs emerging in the southern part, mirroring the
direction of urban sprawl. The southern section, adjacent to Bangkok
and in proximity to Don Muang airport, witnessed UHS emergence due to
urban expansion, notably influenced by the development of the mass rapid
transit (MRT) connecting Pathumtani and Bangkok. The spatial evolution
of UHSs in the study area reflects the dynamic interplay between urban
development, surface characteristics, and heat absorption. The findings
underscore the significance of considering land use and surface
properties in understanding the distribution of urban hot spots and
their potential implications for local climates. Pathumthani may
experience the UHS, where urban areas tend to be warmer than their
rural surroundings. Studying LST can help identify areas with higher
temperatures, contributing to urban planning and mitigating
heat-related issues.
References
[1] Khalil, U., Aslam, B., Azam, U. and Khalid, H. M. D., (2012). Time
Series Analysis of Land Surface Temperature and Drivers of Urban Heat
Island Effect Based on Remotely Sensed Data to Develop a Prediction
Model. Applied Artificial Intelligence. Vol. 35(15),
1803-1828.
https://doi.org/10.1080/08839514.2021.1993633.
[2] Moisa, M. B., Gabissa, B. T., Hinkosa, L. B., Dejene, I. N. and
Gemeda, D. O., (2022). Analysis of Land Surface Temperature Using
Geospatial Technologies in Gida Kiremu, Limu, and Amuru District,
Western Ethiopia. Artificial Intelligence in Agriculture. Vol.
6, 90-99.
https://doi.org/10.1016/j.aiia.2022.06.002.
[3] Wongwan, W. and Pongsawat, S., (2023). Analysis of Correlation
between the Land Surface Temperature, the Land-use and Land-Cover in
Mueang District, Lampang Province.
Journal of Advanced Development in Engineering and Science
. Vol. 13(36), 38-53.
https://ph03.tci-thaijo.org/index.php/pitjournal/article/view/578.
[4] Mansourmoghaddam, M., Rousta, I., Zamani, M. and Olafsson, H.,
(2023). Investigating and Predicting Land Surface Temperature (LST)
Based on Remotely Sensed Data During 1987-2030 (A case study of
Reykjavik city, Iceland). Urban Ecosyst., Vol. 26(2), 337-359.
https://doi.org/10.1007/s11252-023-01337-9.
[5] Ordoñez, C. A. and Silva, D., (2023). Land Use/Land Cover (LULC),
change Detection, and Simulation Analysis of Manila Bay’s Dolomite
Mining Site in Cebu, Philippines Using Sentinel-2 Satellite.
International Journal of Geoinformatics
. Vol. 19(5), 87-103.
https://doi.org/10.52939/ijg.v19i5.2667.
[6] Arunplod, C., Phonphan, W., Wongsongja, N., Utarasakul, T.,
Niemmanee, T., Daraneesrisuk, J. and Thongdara, R., (2023). Spatial
Dynamics Evolution of Land Use for the Study of the Local Traditional
Living Changes. International Journal of Geoinformatics, Vol.
19(4), 37-49.
https://doi.org/10.52939/ijg.v19i4.2635.
[7] Sharaf El Din, E., Elsherif, A., Ramadan, S. and Aboelkhair, H.,
(2023). Mapping of Thermal Indices Using an Automated Landsat
8-based-ArcGIS Model: A Case Study in Alexandria City, Egypt.
International Journal of Geoinformatics
, Vol. 19(9), 1-12.
https://doi.org/10.52939/ijg.v19i9.2823.
[8] Jaelani, L. and Handayani, C., (2022). Spatio-temporal Analysis of
Land Surface Temperature Changes in Java Island from Aqua and Terra
MODIS Satellite Imageries Using Google Earth Engine.
International Journal of Geoinformatics
, Vol. 18(5), 1-12.
https://doi.org/10.52939/ijg.v18i5.2365.
[9] Moazzam, M. and Lee, B. (2023). Elevation-Wise and Direction-Wise
Distribution of Land Surface Temperature in Jeju Island using Landsat 7
Data. International Journal of Geoinformatics, Vol. 19(9),
13-20.
https://doi.org/10.52939/ijg.v19i9.2825.
[10] Mostafa, K. M., (2023). Evaluating the Spatiotemporal Dynamics of
Land Surface Temperature in Relation to the Land Use/Land Cover changes
in Nag-Hammadi District, Egypt, using Remote Sensing and GIS.
International Journal of Geoinformatics
, Vol. 19(3), 13-29.
https://doi.org/10.52939/ijg.v19i3.2599.
[11] Faisal, A. A., Kafy, A. A., Rakib, A. A., Akter, K. S., Dewan, M.
A. J., Sikdar, M. S., Ashrafi, T. J., Mallik, S. and Rahman, M. M.,
(2020). Study for Predicting Land Surface Temperature (LST) Using
Landsat Data: A Comparison of Four Algorithms.
Advances in Civil Engineering
.
https://doi.org/10.1155/2020/7363546.
[12] Mnustafa, E. K., Liu, G., Cao, Y. G., Kaloop, M., Beshr, A. A. A.
and Zarzoura, F., (2020). Assessing and Predicting Land Use/Land Cover,
Land Surface Temperature and Urban Thermal Field Variance Index Using
Landsat imagery for Dhaka Metropolitan Area.
Environmental Challenges.
Vol. 4,
https://doi.org/10.1016/j.envc.2021.100192.
[13] Aldileemi, H., Zhran, M. and El-Mewafi, M., (2023). Geospatial
Monitoring and Prediction of Land Use/Land Cover (LULC) Dynamics Based
on the CA-Markov Simulation Model in Ajdabiya, Libya.
International Journal of Geoinformatics
. Vol. 19(12), 15-29.
https://doi.org/10.52939/ijg.v19i12.2973.
[14] Peng, X., Wu., W., Zheng, Y., Sun, J., Hu, T. and Wang, P.,
(2020). Correlation Analysis of Land Surface Temperature and
Topographic Elements in Hangzhou, China. Sci Rep., Vol.
10(1)1,
https://doi.org/10.1038/s41598-020-67423-6.
[15] Benchelha, M., Benzha, F. and Rhinane, H., (2021). Modeling Urban
Growth and Land-Use changes using GIS Based Cellular Automata: Case of
Benslimane in Morocco. International Journal of Geoinformatics
. Vol. 17(6), 1-14.
https://journals.sfu.ca/ijg/index.php/journal/article/view/2057.
[16] Chopra, R. and Singh, T., (2022). Urban Heat Island Studies and
its Effects Across the Different Cities of the India - A Review.
International Journal of Geoinformatics
. Vol.18(2), 17-27.
https://journals.sfu.ca/ijg/index.php/journal/article/view/2147.
[17] García, D. H., Riza, M. and Díaz, J. A., (2023). Land Surface
Temperature Relationship with the Land Use/Land Cover Indices Leading
to Thermal Field Variation in the Turkish Republic of Northern Cyprus.
Earth Systems and Environment. Vol. 7(2), 561-580.
https://doi.org/10.1007/s41748-023-00341-5.
[18] Sameh, S., Zarzoura, F. and El-Mewafi, M., (2022). Automated
Mapping of Urban Heat Island to Predict Land Surface Temperature and
Land use/cover Change Using Machine Learning Algorithms: Mansoura City.
International Journal of Geoinformatics. Vol. 18(6), 47-67.
https://doi.org/10.52939/ijg.v18i6.2461.
[19] Abdivaitov, K., Strobl, J. and Tynybekova, A., (2023).
Agricultural Land Use Dynamics - A Case Study of Kumkurgan District,
Uzbekistan. International Journal of Geoinformatics. Vol.
19(11), 38-44.
https://doi.org/10.52939/ijg.v19i11.2921.
[20] Selanon, P., Puggioni, F., Dejnirattisai, S. and Rutchamart, A.,
(2022). Towards Inclusive and Accessible Parks in Pathum Thani
Province, Thailand. City Territory and Architecture. Vol. 9,
1-16.
https://doi.org/10.1186/s40410-022-00169-y.
[21] United States Geological Survey. (2023). What are the Band
Designations for the Landsat Satellites?. Available:
https://www.usgs.gov/faqs/what-are-band-designations-landsat-satellites. [Accessed Jan. 22,
2023].
[22] Sekertekin, A. and Bonafoni, S., (2020). Land Surface Temperature
Retrieval from Landsat 5, 7, and 8 Over Rural Areas: Assessment of
Different Retrieval Algorithms and Emissivity Models and Toolbox
Implementation. Remote Sens (Basel). Vol. 12(2).
https://doi.org/10.3390/rs12020294.
[23] Norovsuren, B., Tseveen, B., Batomunkuev, V., Renchin, T.,
Natsagdorj, E., Yangiv, A. and Mart, Z., (2019). Land Cover
Classification Using Maximum Likelihood Method (2000 and 2019) at
Khandgait Valley in Mongolia. IOP Conf Ser Earth Environ Sci.
Vol. 381,
https://doi.org/10.1088/1755-1315/381/1/012054.
[24] Dibs, H. and Alnajjar, H., (2013). Maximum Likelihood for
Land-Use/Land-Cover Mapping and Change Detection Using Landsat Satellite
Images: A Case Study ‘South of Johor.
International Journal of Computational Engineering Research
. Vol. 3, 26-33.
https://www.ijceronline.com/papers/Vol3_issue6/part%202/E0362026033.pdf.
[25] Srivastava, P. K., Han, D., Rico-Ramirez, M. A., Bray, M. and
Islam, T., (2012). Selection of Classification Techniques for Land
Use/Land Cover Change Investigation.
Advances in Space Research
. Vol. 50(9), 1250-1265.
https://doi.org/10.1016/j.asr.2012.06.032.
[26] Agus, F., Prafanto, A. and Kamil, Z. A., (2023). Detecting Land
Use Land Cover Using Supervised Maximum Likelihood Algorithm on
Spatiotemporal Imagery in Samarinda, Indonesia.
3 rd International Seminar of Natural Resources and
Environmental Management 2023
, IOP.
https://doi.org/10.1088/1755-1315/1266/1/012085.
[27] Ghaleb, F., Mario, M. and Sandra, A. N., (2015). Regional
Landsat-Based Drought Monitoring from 1982 to 2014. Climate.,
Vol. 3(3), 563-577.
https://doi.org/10.3390/cli3030563.
[28] Balew, A., and Korme, T. (2020). Monitoring land surface
temperature in Bahir Dar city and its surrounding using Landsat images.
The Egyptian Journal of Remote Sensing and Space Science. Vol.
23(3), 371-386.
https://doi.org/10.1016/j.ejrs.2020.02.001.
[29] Neinavaz, E., Skidmore, A. K. and Darvishzadeh, R., (2020).
Effects of Prediction Accuracy of the Proportion of Vegetation Cover on
Land Surface Emissivity and Temperature using the NDVI Threshold
Method.
International Journal of Applied Earth Observation and
Geoinformation
. Vol. 85,
https://doi.org/10.1016/j.jag.2019.101984.
[30] Kaiser, E. A., Rolim, S. B. A., Grondona, A. E. B., Hackmann, C.
L., de Marsillac Linn, R., Käfer, P. S., da Rocha, N. S. and Diaz, L.
R., (2022). Spatiotemporal Influences of LULC Changes on Land Surface
Temperature in Rapid Urbanization Area by Using Landsat-TM and TIRS
Images. Atmosphere (Basel). Vol. 13(3).
https://doi.org/10.3390/atmos13030460.
[31] Sobrino, J. A., Jiménez-Muñoz, J. C. and Paolini, L., (2004). Land
Surface Temperature Retrieval from LANDSAT TM 5.
Remote Sens Environ
., Vol. 90(4), 434-440.
https://doi.org/10.1016/j.rse.2004.02.003.
[32] Portela, C. I., Massi, K. G., Rodrigues, T. and Alcântara, E.,
(2020). Impact of Urban and Industrial Features on Land Surface
Temperature: Evidences from Satellite Thermal Indices.
Sustain Cities Soc
. Vol. 56.
https://doi.org/10.1016/j.scs.2020.102100.
[33] Guha, S., Govil, H., Dey, A. and Gill, N., (2018). Analytical
Study of Land Surface Temperature with NDVI and NDBI using Landsat 8
OLI and TIRS Data in Florence and Naples City, Italy.
Eur J Remote Sens
., Vol. 51(1), 667-678.
https://doi.org/10.1080/22797254.2018.1474494.
[34] Null, J., (2023). El Niño and La Niña Years and Intensities.
Available:
https://ggweather.com/enso/oni.htm. [Accessed Jan. 22,
2023].
[35] Kirtphaiboon, S., Wongwises, P., Limsakul, A., Sooktawee, S. and
Humphries, U., (2014). Rainfall Variability over Thailand Related to
the El Nino-Southern Oscillation (ENSO).
Journal of Sustainable Energy & Environment
. Vol. 5, 34-42.
https://www.jseejournal.com/media/163/attachment/Rainfall%20Variability%20over%20Thailand%20pp.%2037-42.pdf.
[36] Trakolkul, C., Charoenphon, C. and Satirapod, C., (2022). Impact
of El Niño-Southern Oscillation (ENSO) on the Precipitable Water Vapor
in Thailand from Long Term GPS Observation. International Journal of
Geoinformatics. Vol. 18(3), 13-20.
https://doi.org/10.52939/ijg.v18i3.2197.
[37] Chen, S. and Peake, W., (1961). Apparent Temperatures of Smooth
and Rough Terrain.
IRE Transactions on Antennas and Propagation
. Vol. 9(6), 567-572.
https://doi.org/10.1109/TAP.1961.1145062.
[38] Beek, M. V., (2015). How does Color Affect Heat Absorption?.
Available at:
https://www.discoveryexpresskids.com/blog/how-does-color-affect-heat-absorption.
[Accessed Jan. 22, 2023].
[39] Science Buddies Staff, (2023), How Does Color Affect Heating by
Absorption of Light?. Available at:
https://www.sciencebuddies.org/science-fair-projects/project-ideas/Phys_p030/physics/how-does-color-affect-heating-by-absorption-of-light.
[Accessed Jan. 22, 2023].
